sports-snaps.com
Background
Gaining a useful retroactive understanding of what happened in an American football game is impossible.
If you look up a past game, you will find:
- A scoreline
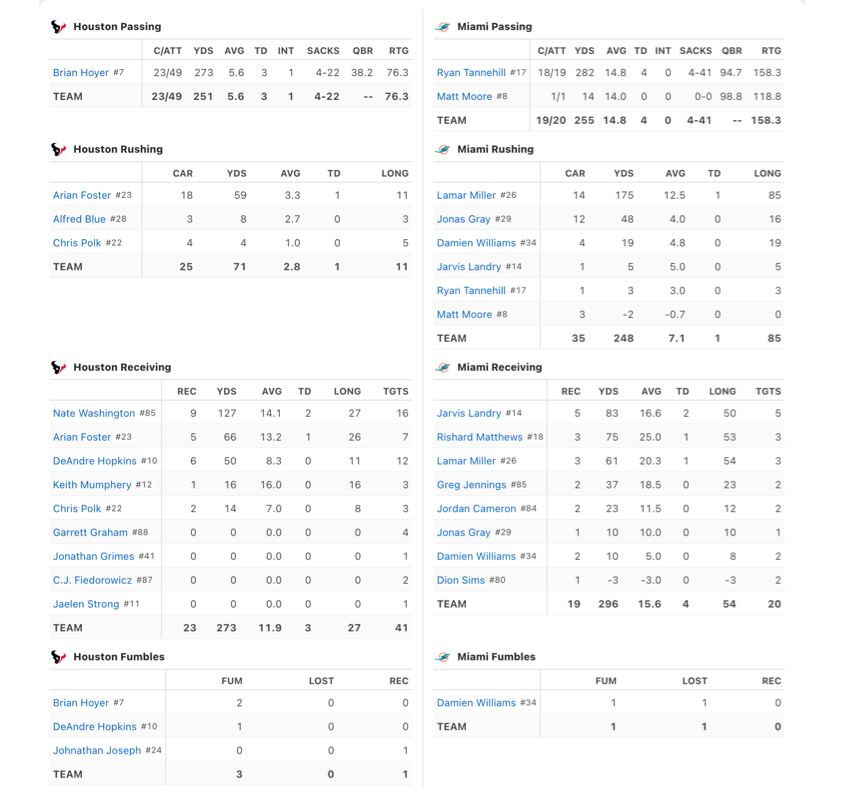
- A table of statistics
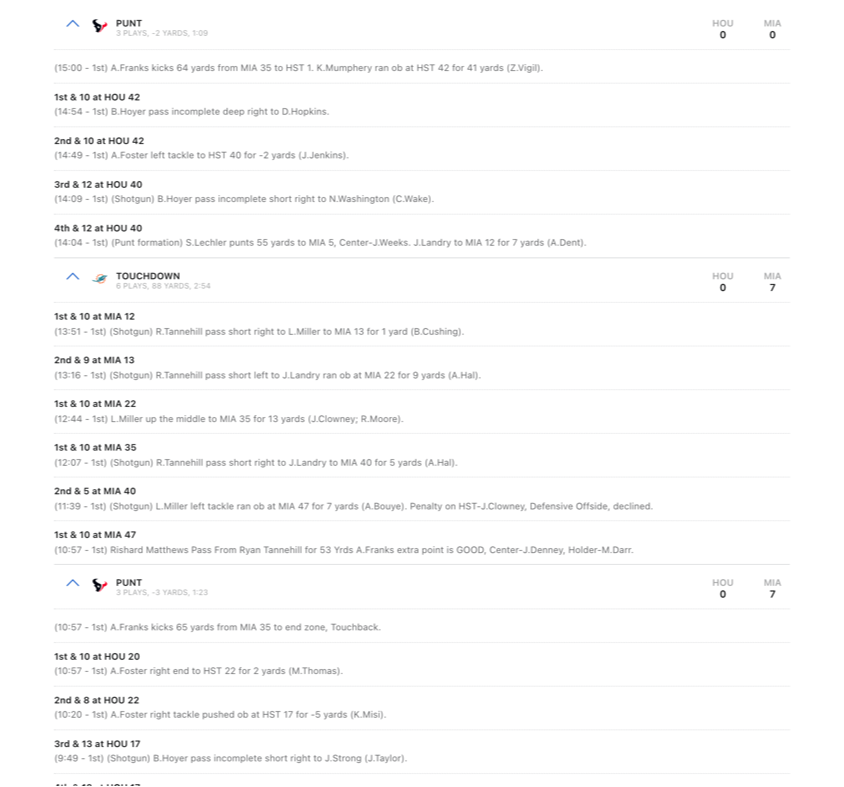
- A written list of play descriptions
I created Sports-snaps.com to look back at games in a more informative way; instead of just getting better at trivia.
The Status Quo
(Blocks of Text)

Note: click each image to enlarge.
Captions
Top-left: the scoreline of a game; points scored by quarter. | Bottom-left: a box score of a football game. Individual player statistics aggregated. | Right: A list of descriptions of each play that happened in the game.
I want to re-live the game's drama...
The goal of sports-snaps is to move the digital experience closer to the dialogue fans have with eachother when talking about a game.
My friends and I refer to the flow of the game, how how we saw the offense/defense play and about specific important plays.
Some common overarching questions include:
- Did one team dominate from start to finish?
- Were the teams evenly matched and the outcome was merely circumstantial?
- Did one team start great and tragically lose at the end?
Changing the Status Quo
Today, overarching questions are typically answered by pundits and most fans default into the mass-media narrative.
Sports-Snaps.com empowers fans to determine for themselves the why and how of a game’s statline through charts.
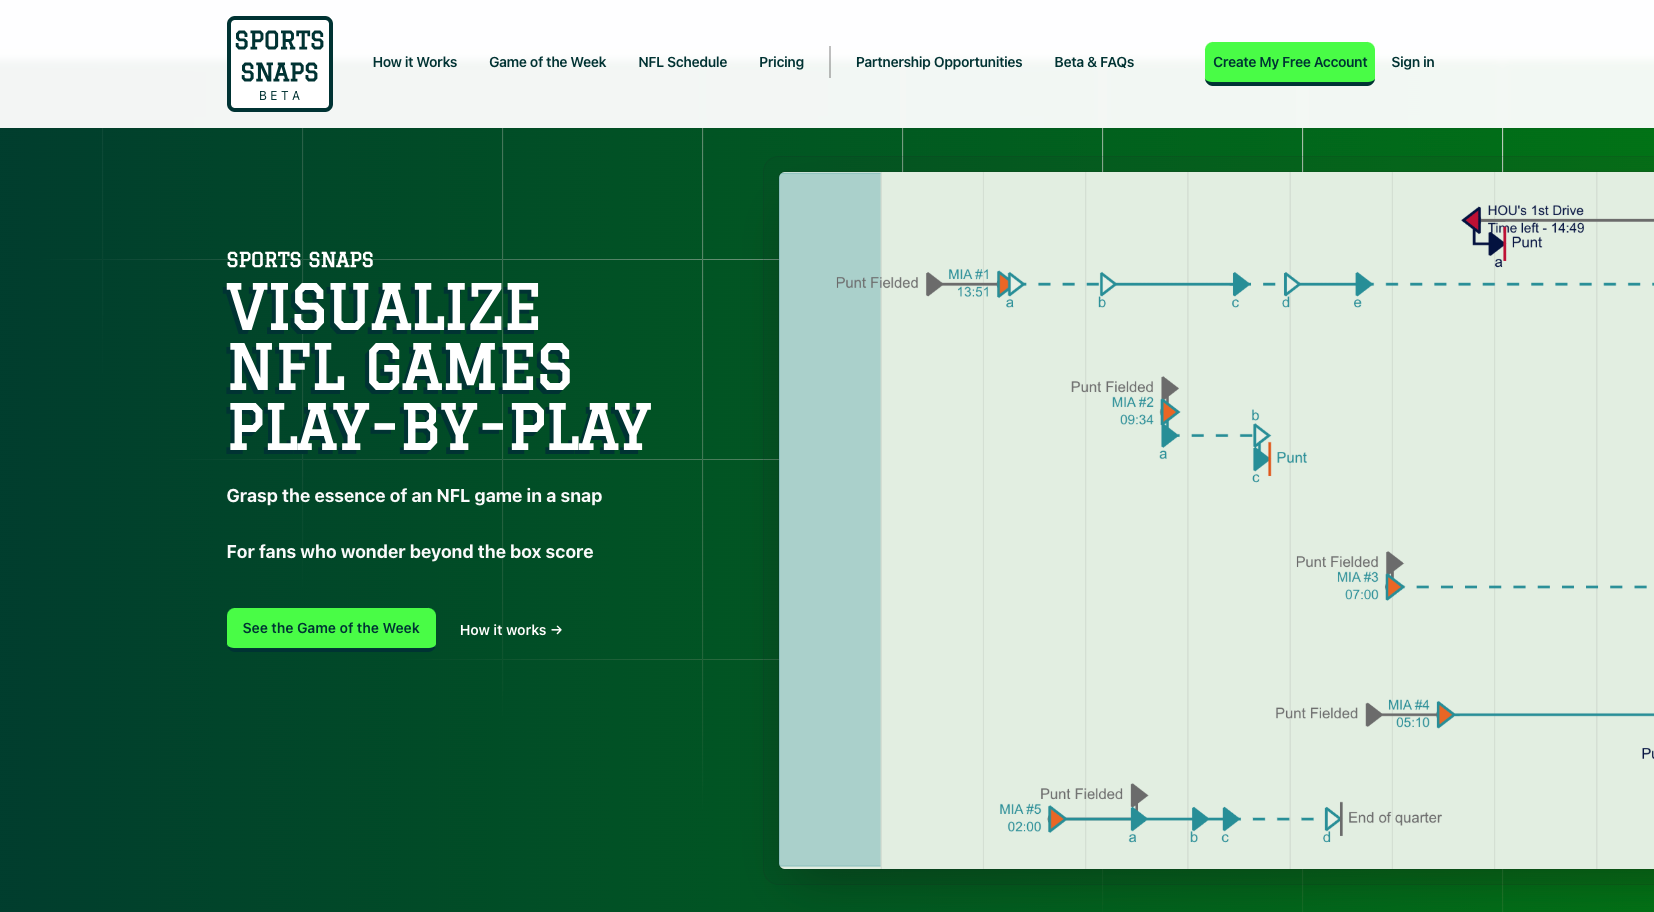
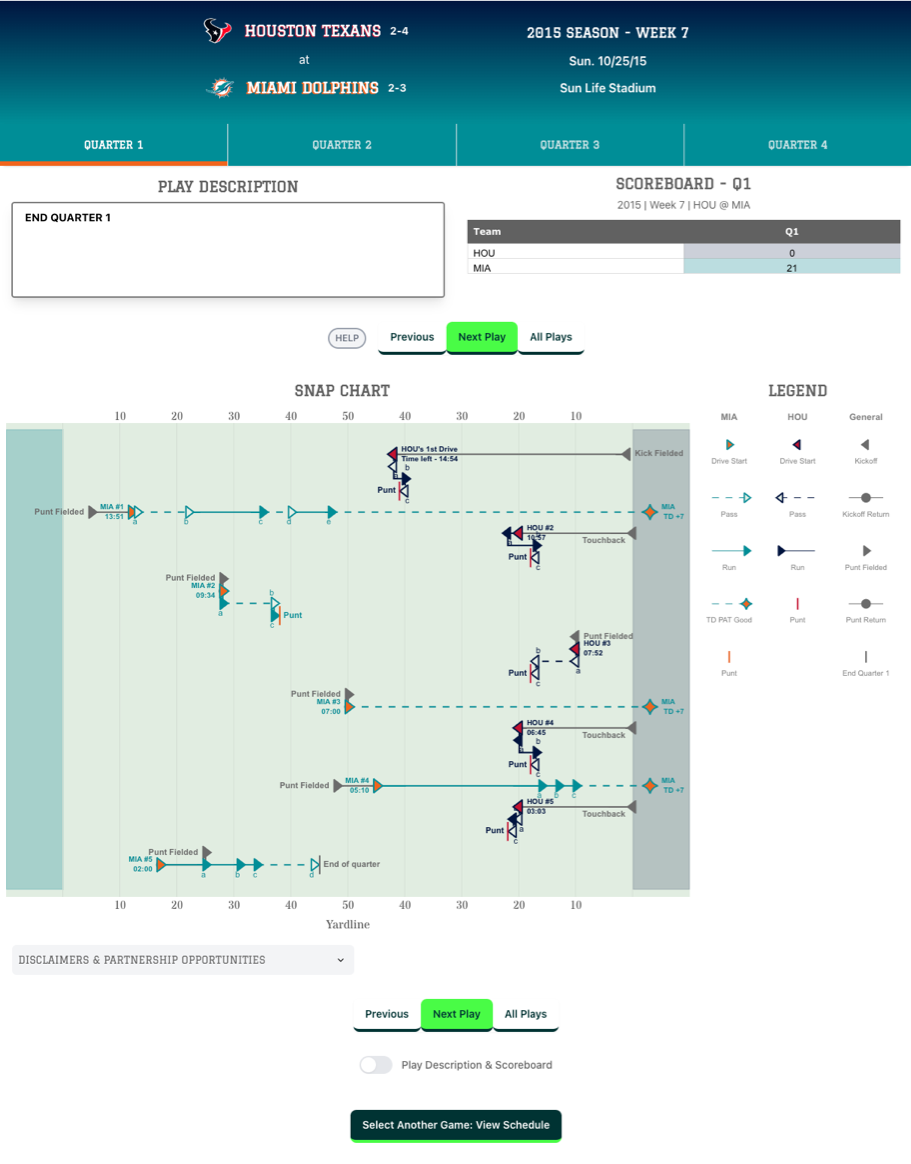
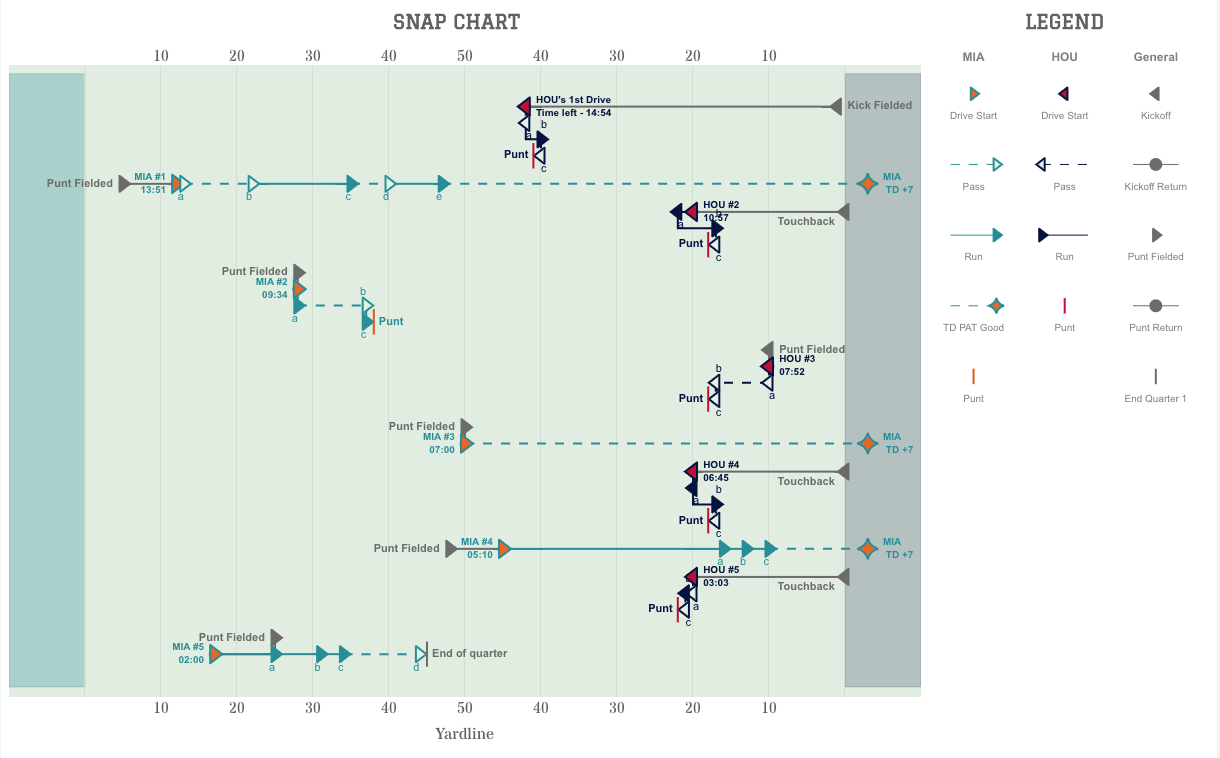
SNap Chart
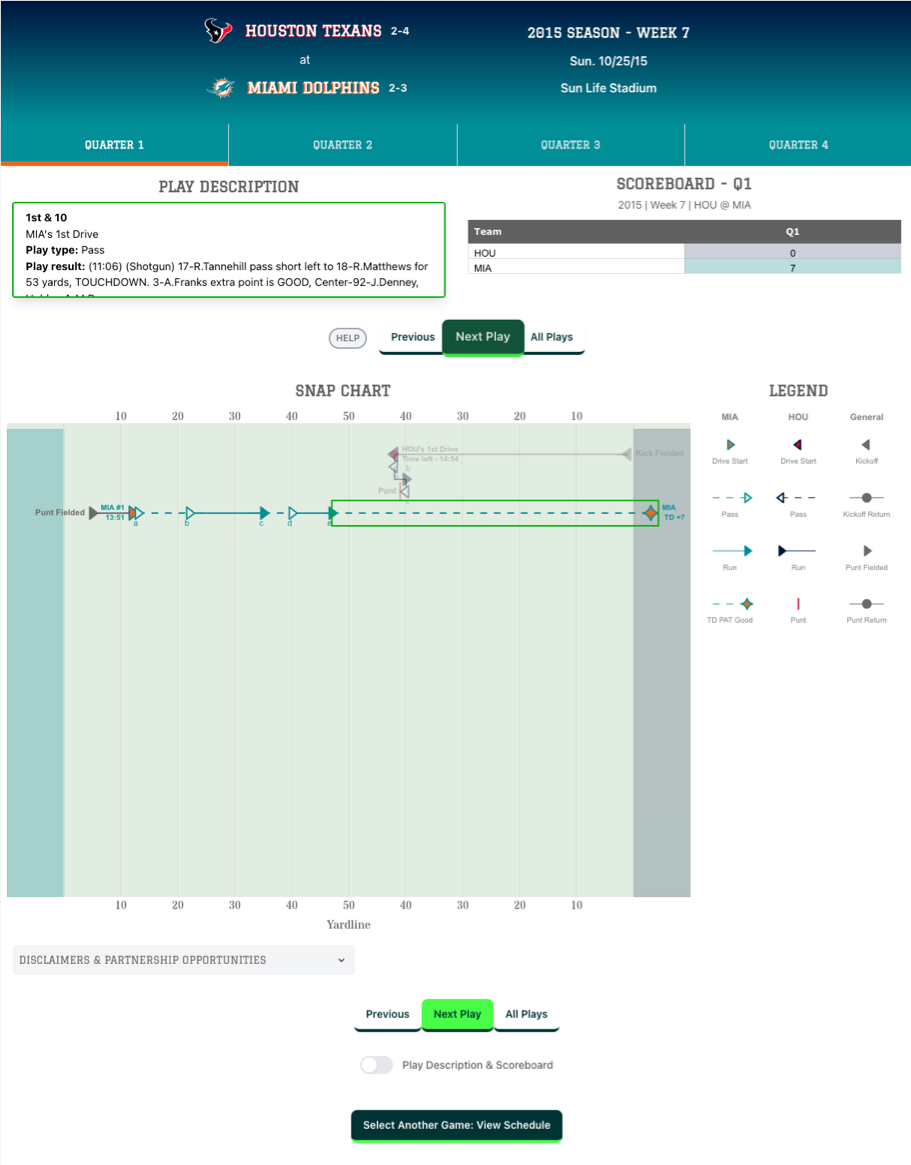
- A Snap Chart has a silhouette of a football field with arrow markers representing plays in the game.
- The green rectangle highlights the current play in the sequence, a touchdown pass by the Miami Dolphins.
MEasuring more Thoughtfully
While box scores provide a way to tally the game’s individual events, measuring each play's impact requires more nuanced insight. Sports-snaps.com employs advanced statistics like EPA (expected points added) and success rate to provide readers with a sharper image of the game’s results.
Visualzing with charts
Charts immeasurably communicate more information than plain text and numbers. Compare for yourself the experience of reading a play-by-play recap to analyzing a snap chart.
Written recap | Snap Chart
My Role
I started working on this project in graduate school by drawing the play-by-play drive chart manually in Photoshop.
I later experimented in R writing a program to generate the Snap Chart digitally for any football game using the NFLFastR dataset.
In 2025 I launched a Next.js web application to make the Snap Chart accessible.
Skills Aquired
Some skills that I've grown while launching this site:
- R
- Rearranging datasets into a desired format
- Scripting functions to perform data scrubbing tasks
- Plotly charts with animations
- Full-stack web development:
- Next.js, React, Firebase
- Patent application process
- AI prompting: how to effectively use AI to improve coding efficiency.

On the Radar
Next steps for app development:
- Usability testing
- Adding EPA and success rate charts
- Finding like-minded fans and spreading the word
- Evolving to meet my users' needs
Learn More
Reach out to me directly if you would like to learn more about this project.